-rw-r--r-- 1 pvenezia pvenezia 97623 May 4 13:55 mrlg-0.01.tgz
Apologies to Tobi Oetiker for the name ;-)
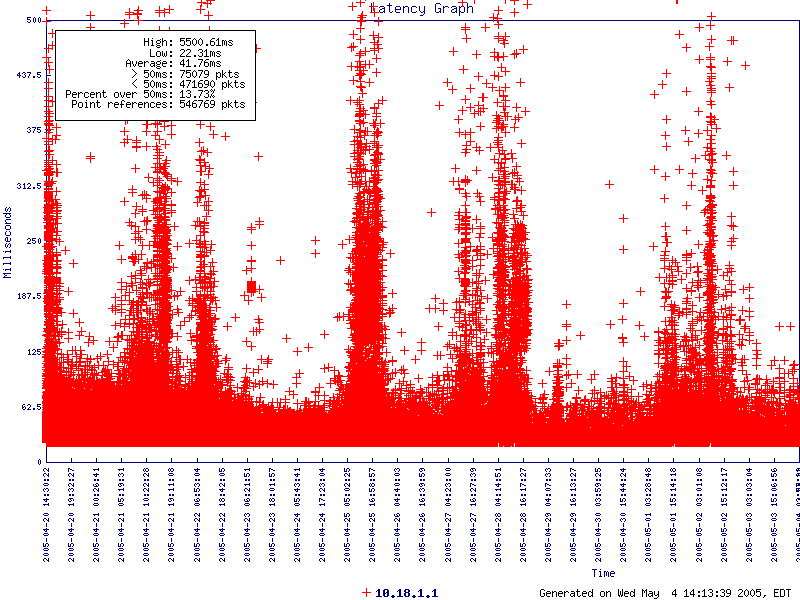
Essentially, MRLG pings a set of hosts every 5s and populates a MySQL database with the resulting latency data and timestamps. From this, GD is used to draw graphs of the latency over time.
MRLG runs as a series of Perl scripts with a PHP frontend.
| File Listing | |
|---|---|
| -- The daemon that pings and populates the DB. | |
| -- The graph generation script. | |
| -- The database maintenance script. | |
| -- PHP frontend files. | |
| -- The configuration file. Lives in /etc. | |
| -- Sample graph collection cron script. | |
Required perl modules:
Required Packages
First, install all required modules and packages.
Next, initalize the MySQL databases:
mysql -u root -p < mrlg.sql
This will create the databases and the 'mrlg' user. Note that this user is assigned a password of 'mrlg'. You should probably change that.
Next, edit the mrlg.cfg file appropriately, and copy the file to /etc.
Copy mrlg.pl, mrlg-graph.pl, and mrlg_dbmaint.pl to /usr/local/sbin, or wherever.
Run the mrlg.pl daemon to begin tracking latency.
Copy the 'php' dir to your webdir, like '/var/www/html/mrlg' and edit index.php appropriately. You're looking for the configuration variables at the top and in the 'gen_graph' function.
Create the appropriate directory structre under $webdir/images. For instance, if you have several sites on one box and want to collect them separately, create $webdir/images/Site1 and $webdir/images/Site2. These dirs will be used by the cron-based graph generation script, and will be organzied by the PHP frontend.
NOTE: The sites concept is for multiple networks, not multiple points on a network. If you only have one MPLS network to worry about, for instance, you'll only have one site. If you admin multiple networks, that's what this is for.
Run 'mrlg-graph.pl' to get an overview of the command-line params.
Next, test mrlg-graph.pl like this:
mrlg-graph.pl -g800x600 -s500 -h10.18.1.1 -f /var/www/html/graph.png -m50 -l "Test Graph" -t1h
obviously replacing the IP with one of your own monitored points, and the output to wherever. If the graph is created, you're good to go.
Now, modify the cron generation script to create graphs for your sites, with the output going to $webdir/images/SiteName.
NOTE: The PHP frontend splits on the '-', so make your graph names something like 'remotesitename-graph$time.png' in this script. The 'remotesitename' will be used to organize the graphs.
Insert the script into cron, running every 30 minutes or 1 hour, depending on the load it creates on the server. At the same time, add the mrlg_dbmaint.pl script to cron, and run it at 3am or 4am. It only needs to be run once a day.
Once this is done, you should see graphs populating in the PHP frontend. Also, you should be able to use the instant graph generator to draw graphs on the fly. Make sure that the $webdir dir is writable by the httpd user (apache, www, or similar) for the instant generator to be able to write to the image. Alternatively, chown the existing image to that user.
This is a 0.01 release, and it looks like it. If you want to modify the way the graphs look, take a peek at GD::Graph and modify the mrlg-graph.pl script.
Probably lots. There's no real error checking anywhere.
Combine Perl/PHP configs
Clean up Web interface
Bugfixes
Matt Prigge wrote the PHP code initially, I just hacked it to pieces.